|
The scientific analysis performed by the user on the data collected by the three high-energy instruments on-board INTEGRAL has a lot of commonality, despite the various differences in detail. In a certain step, for example, events are corrected for instrumental fingerprints, in another one events are binned into detector maps, and in yet another step sky images are derived by image deconvolution.
In order to make this more transparent for scientists working with
data from several instruments, so-called Analysis Levels were
identified by the ISDC and designated with unique labels. The order of
these levels, the detailed processing and the details of the outputs
may differ across instruments, but in general, a given level will mean
similar tasks and similar outputs for JEM-X, IBIS, and SPI. The list
of all levels is given in the Introduction to the INTEGRAL
Data Analysis [1]. For JEM-X the following levels have been
defined:
| Tasks | Description |
| COR | Data Correction |
| GTI | Good Time definition and handling |
| DEAD | Dead Time derivation |
| CAT_I | Catalogue source selection for Imaging |
| BIN_I | Event binning for Imaging |
| IMA | Image reconstruction, source flux determination |
| SPE | Source spectra and response extraction (for XSPEC) |
| LCR | Source light curves extraction |
| BIN_S | Event binning for Spectral Analysis |
| BIN_T | Event binning for Timing Analysis |
| IMA2 | Creation of mosaic images and summary on sources found |
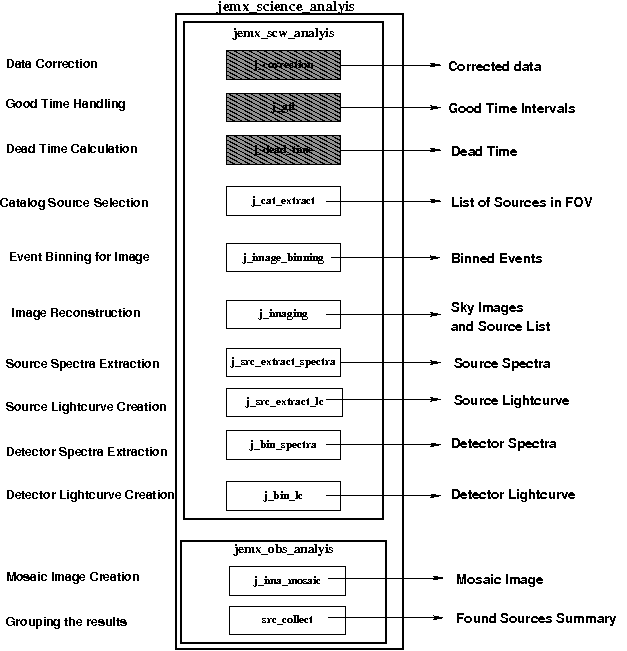
Figure 9 shows the Scientific Analysis overview. The details of each step are briefly discussed below.
Corrects science data for instrumental fingerprints such as energy and position corrections, as well as flagging events of dubious quality. Look up tables of pre-flight corrections are used, as well as tables of in-flight calibrations determined by offline analysis of science data, calibration spectra, and instrumental background lines. Dynamic determination of known transient problems (e.g. hotspots on the detector) is also done in this level. The majority of calibration tables are stored in the Instrument Model group, JMXi-IMOD-GRP (with i = 1 and 2 for JEM-X1 and JEM-X2, respectively), but the offline gain history Instrument Characteristics tables are stored separately in JMXi-GAIN-OCL data structures. The latter are also located automatically by the OSA software just like the IMOD group.
Good Time Intervals (GTIs) are used in the analysis to select only those data taken while the detector was considered to work correctly. The corresponding data structures consist simply of a list of start and stop times of those intervals considered ``good''. Usually, these intervals are generated based on the following data:
In addition, this step excludes by default periods when the instrument configuration is not adapted to the production of scientific works, either because of hardware problems or because of intentional modifications of the instrument configurations for the purpose of testing and calibrations. These periods are marked as "bad time intervals"in the Instrument Characteristics data.
For each 8 second onboard polling cycle, this level calculates the dead time during which photons are lost due to finite read in time of registers, event processing time, grey filter losses, buffer losses and double event triggers.
Selects a list of known sources from the given catalogue. Creates a source data structure, containing source location and expected flux values.
Defines the energy bins to be used for imaging, selects good events within the GTI, and creates shadowgrams. Works only on FULL and REST data (see Table 2).
Generates sky images and performs search for significant sources. If sources are detected, a new source data structure is created, including part of the information from the input catalogue concerning the identified sources. Works only on FULL and REST data (see Table 2)
Extracts spectra for individual sources found at IMA step, and produces the specific response files (ARFs) needed for spectral fitting with the XSPEC package. Works only on FULL data (see Table 2).
Produces light curves for individual sources. Works only on FULL data (see Table 2)
Creates detector spectra, i.e spectra of all events recorded within the GTI are corrected for greyfilter, ontime and deadtime. A series of spectra resolved in time or phase over a given period can be produced.
Creates binned lightcurves for entire detector area.
Generates mosaic sky images and creates the list of all found sources. Works only on FULL and REST data (see Table 2)
Since October 18, 2004, all public INTEGRAL data are available including already the correction step, and also the instrumental GTI and deadtime handling have been already performed at the science window level. This allows to speed up the scientific analysis of JEM-X data as there is no need to redo the COR, GTI and DEAD levels, but you can directly start JEM-X analysis from the CAT_I level.
It is however recommended that users run the science analysis from the COR level onwards, especially after downloading new software, and IMOD/IC files. This will undoubtedly give better results than the archived data. Archived data necessarily fossilize our understanding of the instruments as it was at the time of the archival processing and can therefore be several years out of date since our knowledge of the instruments, and the software to process the data is still improving.